 FIGURE 1
SPECT MIBI FEMALE ATTENUATION
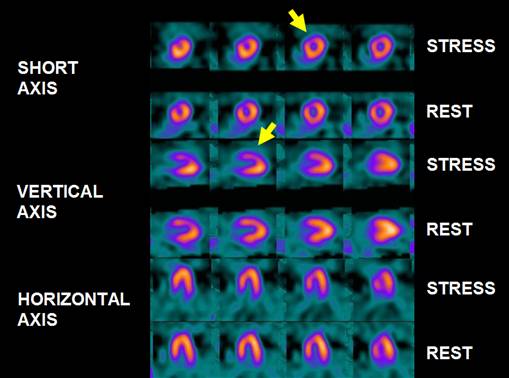
FIGURE 1
Female patient, 56 year old, with abnormal ECG stress test. BMI (body mass index) 39, weight 110 kg and height 159 obesity. In FIGURE 1, it can be seen a normal-sized left ventricle. No lung uptake. The post-stress ejection fraction was 67% and 69% at rest, with preserved wall motion. Perfusion is heterogeneous, highlighting lower activity in the anterior-apical-septal territory diffuse pattern, which tends to some improvement at rest. The other walls are well perfused. Global and segmental normal systolic function . The image described in antero-apical-septal area suggets attenuation (variant due to high BMI).
Attenuation-corrected (AC) normal patient files were created from 37 normal
subjects with a low likelihood (<3%) of CAD. The diagnostic performance of AC
for detection of CAD was evaluated in 118 patients who had stress technetium 99m
sestamibi or tetrofosmin stress SPECT imaging and coronary angiography. CT-based
AC of SPECT images consistently improved overall diagnostic performance of
readers with different interpretive attitudes and experience. CT-based AC is
well suited for routine use in clinical practice (1).
Gated-SPECT
with Tc-labeled compounds with AC by hybrid SPECT/computed tomography (CT) was
performed in 56 male patients with documented previous inferior myocardial
infarction. The combination of diaphragmatic attenuation and inferior myocardial
infarction determines an artifactual overestimation of infarct size of inferior
infarcts. The AC regional perfusion score (SRS) correlates with the regional
wall motion score of the inferior wall. AC does not affect the detection and
size of residual ischemia (SDS) (2).
Massod Y et
al. on 152 patients: 83 with CAD (> 50% stenosis at angiography), 32 with
insignificant CAD (< 50% stenosis at angiography). 37 Normal volunteers.
Performance: Sensitivity: Non Corrected (NC) = 93%, AC = 94%; Specificity: NC =
56%, AC = 59%; Predictive accuracy: NC = 83%, AC = 84%; Normalcy rate: NC = 84%,
AC = 97% (3).
Thirty-six
patients with spontaneous and 12 with pacemaker-induced LBBB (mean age 68.6 +/-
9.7) underwent gated 1-day adenosine stress/rest Tc-99m tetrofosmin SPECT on a
hybrid SPECT-CT. Spontaneous and PM-induced LBBB often induces typical
perfusion defects in myocardial perfusion at stress, partly reversible at
rest. With IR-AC this typical pattern is more pronounced and less reversible,
strengthening the confidence to discriminate such findings from ischemia (4).
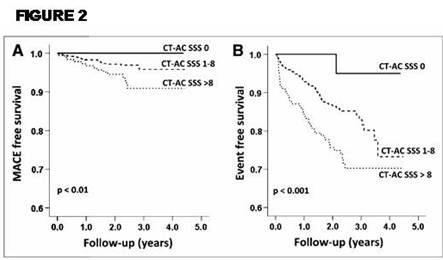
FIGURE 2.
Kaplan–Meier survival curves for MACE-free and event-free survival
illustrates the survival free of MACEs (A) and free of any event (B) for the
low-, intermediate-, and high-risk groups (i.e., CT-AC SSS 0, 1–8, and .8).
Direct comparison of CT-AC and FBP of an SSS of 1–3 by a x2 test reached a P
value of 0.05 for MACEs and a P value less than 0.01 for any cardiac events (5).
The addition
of CTCA to MPI SPECT may avoid false negative scintigraphic findings in advanced
three-vessel disease, showing a balanced impairment of blood flow in all cardiac
segments (6).
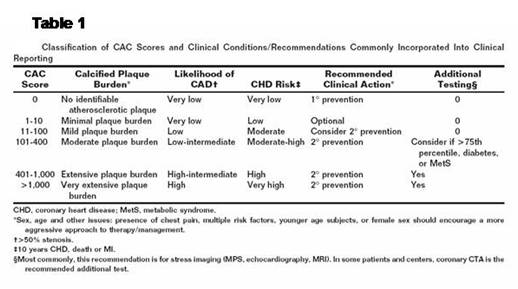
The TABLE 1 depicts the calcification scores (7).
Chang et al.78 recently reported, in a population of 1126 asymptomatic subjects undergoing CAC imaging and MPS, that in subjects with a normal MPS, coronary calcification added incremental prognostic information, with a 3.55-fold relative increase for any cardiac event (2.75-fold for death/MI) when calcification was severe (‘Agatston Score’ 400) vs. minimal (‘Agatston Score’ 10). Interestingly, separation of the survival curves occurred at 3 years after initial testing for all cardiac events and at 5 years for death/MI, indicating an incremental mid- to long-term prognostic value of the CAC score over MPS. In contrast, Rozanski et al.,77 in an asymptomatic population at lower cardiovascular risk, observed no increased risk in subjects without inducible ischaemia but with high CAC scores (8).
References:
1 Masood Y et al. Clinical validation of SPECT attenuation correction using x-ray computed tomography-derived attenuation maps:multicenter clinical trial with angiographic correlation. J Nucl Cardiol. 2005 Nov-Dec;12(6):676-86.
2 The value of attenuation correction by hybrid SPECT/CT imaging on infarct size quantification in male patients with previous inferior myocardial infarct. Giubbini RM et al. Nucl Med Commun. 2011 Nov;32(11):1026-32.
3 Massod Y et al. SPECT/CT Attenuation Correction Improves Specificity and Normalcy Rate: A Multi-center Trial. ASNC Sept 30-Oct 3, 2004, NY.
4 Hoefflinghaus T et al. Role of attenuation correction to discriminate defects caused by left bundle branch block versus coronary stenosis in single photon emission computed tomography myocardial perfusion imaging. Clin Nucl Med. 2008 Nov;33(11):748-51.
5 Aju P. azhenkottil at al. Improved Outcome Prediction by SPECT Myocardial Perfusion Imaging After CT Attenuation Correction. J Nucl Med 2011; 52:196–200.
6 Giuliano Mariani et al. A review on the clinical uses of SPECT/CT. Eur J Nucl Med Mol Imaging (2010) 37:1959–1985.
7 Daniel S. Berman et al. Comparative Use of Radionuclide Stress Testing, Coronary Artery Calcium Scanning, and Noninvasive Coronary Angiography for Diagnostic and Prognostic Cardiac Assessment. Semin Nucl Med 37:2-16 2007.
8 Perrone-Filardi P. Cardiac computed tomography and myocardial perfusion scintigraphy for risk stratification in asymptomatic individuals without known cardiovascular disease: a position statement of the Working Group on Nuclear Cardiology and Cardiac CT of the European Society of Cardiology. Eur Heart J. 2011 Aug;32(16):1986-93.
Home Index Myocardial Perfusion Spect Mibi Normal Images Index